Google Data Analytics Capstone Projects
Google Data Analytics Capstone Projects
The conclusion of the Google Data Analytics Certificate Program incorporated using all cumulative skills and knowledge from the course to produce full length data analytics projects. These projects were given by the course with a full guide and rubric on how the projects could be completed. The projects showcased in this section of the portfolio are:
- Bellabeat Inc. Product Analysis
- Blockchain Investment Analysis
The “Product Analysis” project was guided by the course. It serves as a stepping stone into producing the final project as an unguided, student-chosen project which is the “Blockchain Investment Analysis.” The following project sections will provide a summary of the six stage data analytics process that the analyst should undertake as they begin a full scale data project.
- Each of the project’s files will be found in the “Appendix” section at the bottom of the webpage.
Bellabeat Inc. Product Analysis Project
Files included
- Project Presentation File
- R Markdown File
The scenario outlined for this project is that the student assumes the role as a new analyst on the Bellabeat Inc. product team. The Chief Marketing Officer has requested an analysis of Fitbit user data to be used to improve Bellabeat’s own smartphone application for their own users.
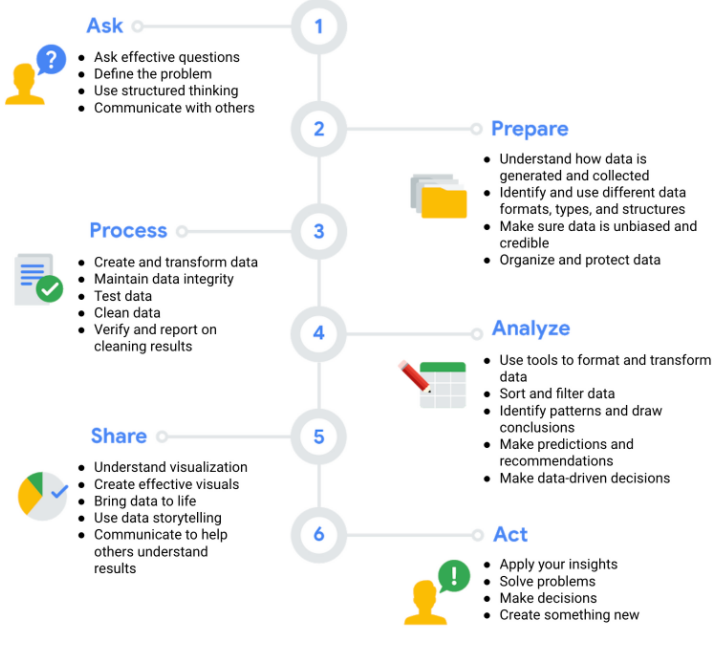
Ask Phase: This phase is designed to make sure the analyst is aligned with the project business objectives and that the project’s stakeholders are defined and taken into account.
Prepare Phase: To prepare for the analysis of the data, the analyst must check the integrity of the data source and understand where the data is coming from and to save it securely. Kaggle.com provided the dataset by a reputable user with an open-source license to use. Kaggle.com is used by large-sized corporations for data science purposes and is trusted by the data science community, therefore the integrity of the data sets have been confirmed.
Process Phase: In the process phase, the analyst cleans the data by checking for errors, filtering the data to find the most prevalent information, combining and manipulating data to streamline the process of analysis. The Data Cleaning Log is outlined in the “R Markdown File,” where the entire process of cleaning is outlined with reasoning on why specific actions were performed.
Analysis Phase: Once the data cleaning has concluded, several avenues of analysis appeared and were inspected in order to derive valuable insights for the business objective. The data showed that for each different function - calorie tracking, sleep logs, weight log - of the Fitbit application data saw a decreasing user participation from the “unique IDs” varibable. The amount of logs decreased from calorie tracking to sleep log, then greatly decreased from sleep log to weight log.
In order to accurately gauge user participation in calorie tracking, it would be important to note which days of the week saw large traffic of logs versus which days did not. To better represent this analysis, average calories burned was included in a new data frame in R. This then displayed the most active day for logging calories burned was Thursday and the least logs for calories buried was Tuesday.
Some of the summary statistics of the dataset for calorie tracking saw a large discrepancy from median and mean values of the “Active Minutes” variable. This indicated that some very active users were skewing the data and increasing the average of active minutes trained in the calorie tracking function of the application.
A linear regression model was constructed to see the relationship between the two variables: calories burned and the total steps taken for that time interval. This would provide insight into potential marketing efforts to encourage the user to “simply walk and burn calories.”
Share Phase: To be able to effectively relay the insights to stakeholders, using visualizations would be appropriate. This form of communication can allow easy transmission of important information tailored to your specific audience. Three visualizations were drafted to showcase the analysis in an efficient manner.
- Bar chart to visualize display the average calories burned by day and show comparison of each day against the others.
- Scatterplot for total user records for each day of the week to see which days were the most and least active in user participation.
- Scatterplot with a linear trendline displayed to help show the relationship between the two variables being analyzed.
Act Phase: After the visuals and analyses were reviewed, the final recommendation to improve the marketing strategy of the Bellbeat’s smartphone application was to design a dynamic alert system to encourage user participation in logging their data for the day. This alert system produces a truly “smart” experience to the user.
Blockchain Investment Analysis Project
After the conclusion of the guided project from Bellabeat Inc, the final capstone data project was a student-chosen topic. I chose to focus on the emerging cryptocurrency and digital asset market.
Files included:
- Blockchain Investment Presentation
- Blockchain Investment Excel File
The scenario for the project outlines that I am a junior analyst in a business intelligence consultancy firm. The client is a family office asset manager seeking to allocate capital into the cryptocurrency and digital asset market. The task involves presenting an analysis of two assets: Ethereum and Cardano, and showcasing evidence of which asset should receive the allocation.
The first section of the presentation summarizes the digital asset landscape with examples of major assets in the space while summarizing their main benefits for market participants and protocol users.
Next, Ethereum and Cardano are given a brief timeline of major events that have transpired in the creation of these blockchain protocols. Both Cardano and Etheruem’s smart contract functionality and blockchain characteristics are outlined in order to give the client information into the technology they would be allocating capital to.
Ask Phase: The objective of this presentation is to provide an analysis of two different blockchain investments for our family office client. Family offices handle the wealth of high net worth individuals. A precise analysis of these investments are needed to bring them to a conclusion of which asset to invest. The metrics used in this analysis will be:
- Price-to-Revenue Ratio
- End-of-year Forecasted Revenue
- Price-to-Transactions-Count Regression Analysis
Prepare Phase: The data was located on CoinMetrics.io. This company is an open source blockchain data collection firm that directly pulls data from the blockchain’s base security ledger. CoinMetrics.io is respected throughout the industry and provides a multitude of different data products for investors to use for different purposes. Each dataset has 1500+ observations and provides many necessary variables for analysis.
Process Phase: To prepare the data for analysis, I followed a five step process to clean and filter the data.
First, the data must be downloaded and stored in a folder where the data can be accessed at any time.
Second, a Microsoft Excel workbook was created and the data was imported to the file. The original data was copied to its own sheet, where it would not be manipulated in anyway to allow for future revisions to the analysis, and allow stakeholders to see the original data.
Third, the data was sorted and filtered to find any null values or errors in the data. This is helpful to see how each observation is organized with its corresponding variables. I chose to have both datasets begin at the sametime to provide a fair and consistent comparsion. The Cardano dataset had ~1 month of data deleted because the blockchain wasn’t live recording specific variables at that time.
Fourth, the “Total Revenue” variable for Cardano was not present in the original file. However, there was a “Fee Generated Per Interval” variable which when totaled per year, would create the “Total Revenue” variable needed for analysis.
Finally, a summarized table of key data totals was drafted for use in the Price-to-Revenue ratio and the forecasted revenue analysis.
Analysis Phase: The three different metrics being used to compare Cardano and Ethereum’s native assets were chosen to provide a replicable analysis of traditional equities with new variations and techniques that fit with the digital asset characteristics. This can allow the client who may only be familiar with traditional assets, receive an analysis that they can quickly use for their intended purposes.
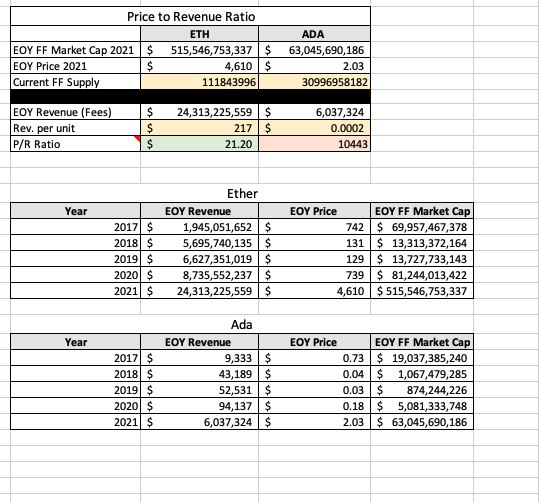
Price-to-Revenue Ratio
This ratio is similar to the Price-to-Sales Ratio used to evaluate the revenue afforded to one share of a company. It can show how expensive or cheap one unit of a company is compared to its revenue (or sales) generation. The inputs used for this analysis were:
- Free Float Market Capitalization
- Price USD
- EOY Revenue 2021
Ethereum’s P/R ratio was 21.2 and Cardano’s was 10,443. Several factors have to be mentioned in order to justify Cardano’s large ratio. Cardano’s blockchain has been operating for two less years than Ethereum and has only recently released smart contracts, a large driver of fees from transactions such as swapping, lending and borrowing on decentralized finance applications. Another important factor is that Cardnao’s competitive advantage is to produce far smaller fees compared to Ethereum. However, it is still too large of a ratio to confirm success in this metric.
Additional analysis for Ethereum was conducted with Visa and Mastercard’s shares being used as comparative proxies. This is because Ethereum can be seen as a decentralized settlement network just as Visa and Mastercard are the centralized equivalents. Visa’s P/S ratio is 20.25 and Mastercard’s P/S ratio is 20.20. When compared to Etheruem’s P/R ratio, they are almost identical. Ethereum, Visa, and Mastercard are similarly valued in this ratio.
Forecasted Revenue Projections
The second analysis conducted for Cardano and Ethereum was to compare the forecasted revenue for the next five years. Since both Cardano and Etheruem are smart contract platforms and generate fees for the block validators, seeing the revenue in total fees generated can be a good indicator of growth of usage of the networks. To conduct this analysis, the previous EOY Revenue totals were used. From determining the growth rate year over year, you are able to use those growth rates, paired with a weighted average determined by the analyst, to project the revenue. I chose specific assumptions in the model based on my own understanding of the industry. I gave less weighting to the extreme growth rate years and higher weights to the smaller growth rate year because of the assumption that the networks will mature and follow a steady growth rate.
Price-to-Transaction Count Regression Analysis
The final analysis is a regression model for the price and transactions per day variables. The client is looking to invest capital into one of these protocols, it is necessary to use variables such as transactions per day and price and showcase if they have any correlation to each other. Transaction per day is a great indicator to establish growth of the networks and price is the value of the asset itself. The two metrics to be used after the model is constructed will be the “Correlation Coefficient” value; positive, negative or no relationship, and “Goodness-of-fit” value: how strong the relationship is based on different trendlines.
Ethereum
- Correlation Coefficient: 0.684 (Fairly Correlated)
- Linear R-Sqaure Value: 0.469
- Exponential R-Sqaure Value: 0.5533 (Strongest Relationship)
- Logarithmic R-Sqaure Value: 0.2271
- Power R-Sqaure Value: 0.5233
Cardano
- Correlation Coefficient: 0.901 (Extremely Correlated)
- Linear R-Sqaure Value: 0.8128
- Exponential R-Sqaure Value: 0.0109
- Logarithmic R-Sqaure Value: 0.7798
- Power R-Sqaure Value: 0.8430 (Strongest Relationship)
The results showed that both networks show a positive relationship with asset price and transactions per day. The more transactions that are occuring the network, we can assume that the price of the asset will increase as the network matures and more users are transacting. Cardano had the stronger of the two assets in terms of the relationship of the variables. Cardano’s strongest R value for the model was the power trendline while Ethereuem’s was exponential. Exponential trend lines are preferable to power trendlines as the power trend relationship begins to level out the more the x-axis variable increases. However, Etheruem’s correlation coefficient was not as strong as Cardano’s, highlighting that Cardano is a safer bet when it comes to the growth of the networks.
Share Phase: Corresponding visualization to the forecasted revenue and regression analysis were created to better showcase the findings to the client. The forecasted revenue analysis was visualized using solid and dotted lines for historical and forcasted values, respectively. These techniques were used as the forecasted revenue analysis covers growth over a period of time and the different lines were used to enhance the understanding of the chart. The regression analysis visuals were used to showcase the linear regression equations for both Ethereum and Cardano and the relationship between the two variables: transactions per day and price
Act Phase: The final stage of this blockchain investment comparison project was to outline the potential next steps the family office could take in terms of their allocation. First, some future plans for both networks were outlined to provide context on where these networks are currently in their development cycle. Both Ethereuem and Cardano are launching upgrades to their networks in 2022 to improve scalability and improve retail user experience. The allocation from the family office should depend on the time frame which the asset managers will keep the assets in their possession.
- Ethereum’s price will react positively to the upcoming upgrades to the network and will continue to have steady growth as this network is more mature than Cardano’s. The family office should allocate to Ethereum with a < 1 year time horizon.
- After this year concludes, Cardano and Etheruem’s roadmap of development should be implemented and new users will be using these platforms. To hedge the allocation, the family office should allocate 50% Ethereum and 50% Cardano for a 1-3 year time horizon.
- For a far future outlook, Cardano’s superior infrastructure for scaling, fee generation and overall growth in users coupled with Cardano’s focus on international markets rather than soley in the U.S will allow Cardano to be dominant in the cryptocurrency and digital asset space. For a 3+ year time horizon, the family office should allocate to Cardano.
Appendix: Product Analysis
Bellabeat Inc. Product Analysis Presentation
R Markdown File
Appendix: Blockchain Analysis
Blockchain Investment Presentation
Blockchain Investment Excel File